 EasySep™小鼠TIL(CD45)正选试剂盒


产品号 #100-0276_C
cGMP,稳定无饲养层维持培养基,适用于人ES和iPS 细胞
若您需要咨询产品或有任何技术问题,请通过官方电话 400 885 9050 或邮箱 info.cn@stemcell.com 与我们联系。
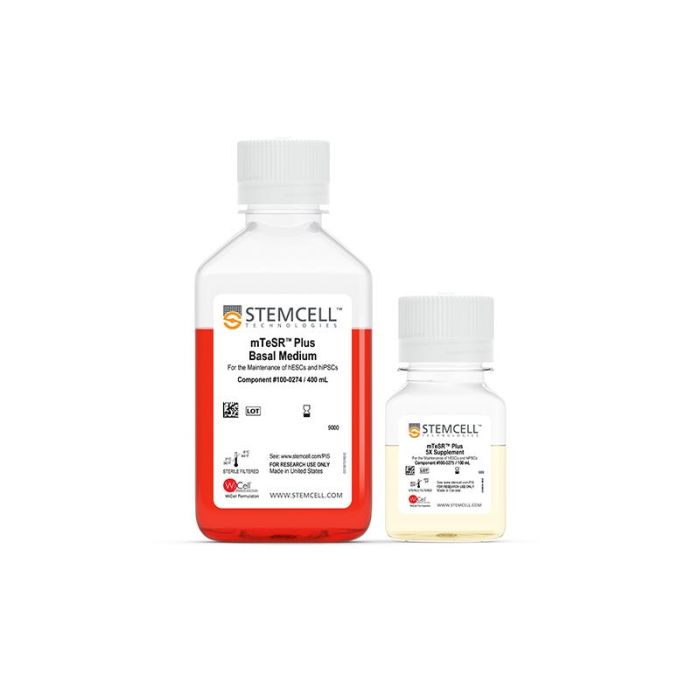
cGMP,稳定无饲养层维持培养基,适用于人ES和iPS 细胞
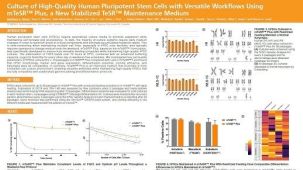
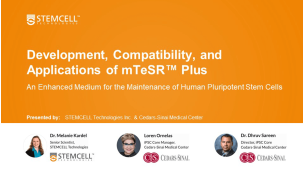
Innovation is a core value at STEMCELL. The evolution to mTeSR™ Plus reflects that and our desire to serve the next generation of pluripotent stem cell researchers.

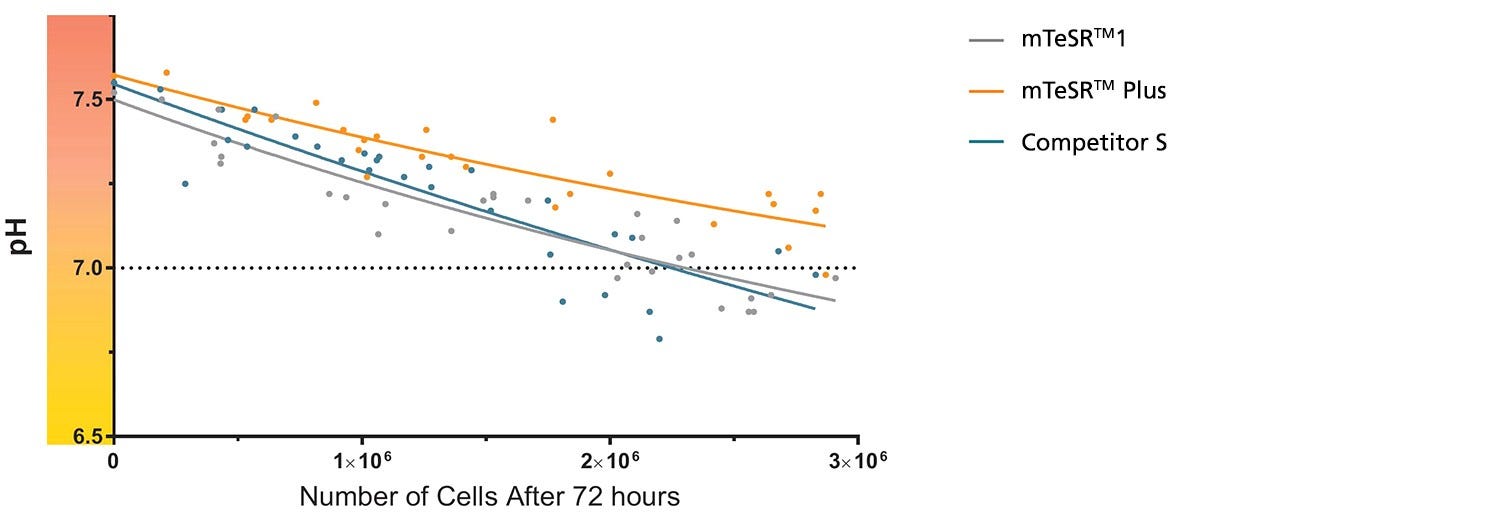
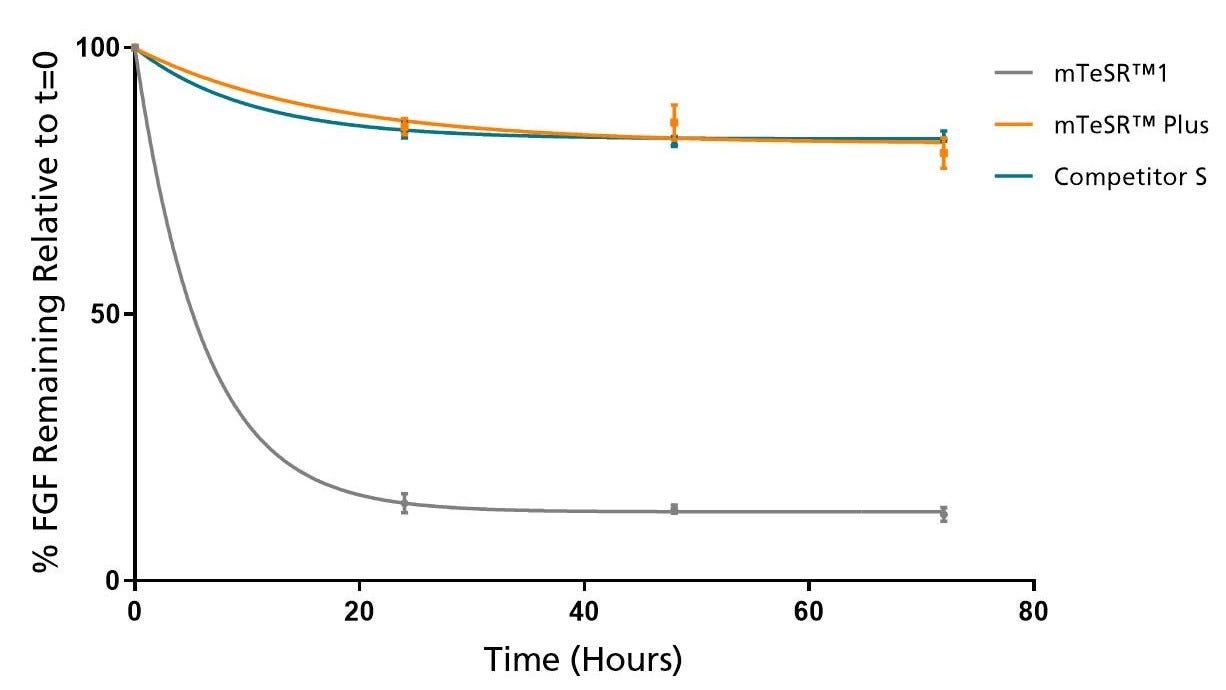
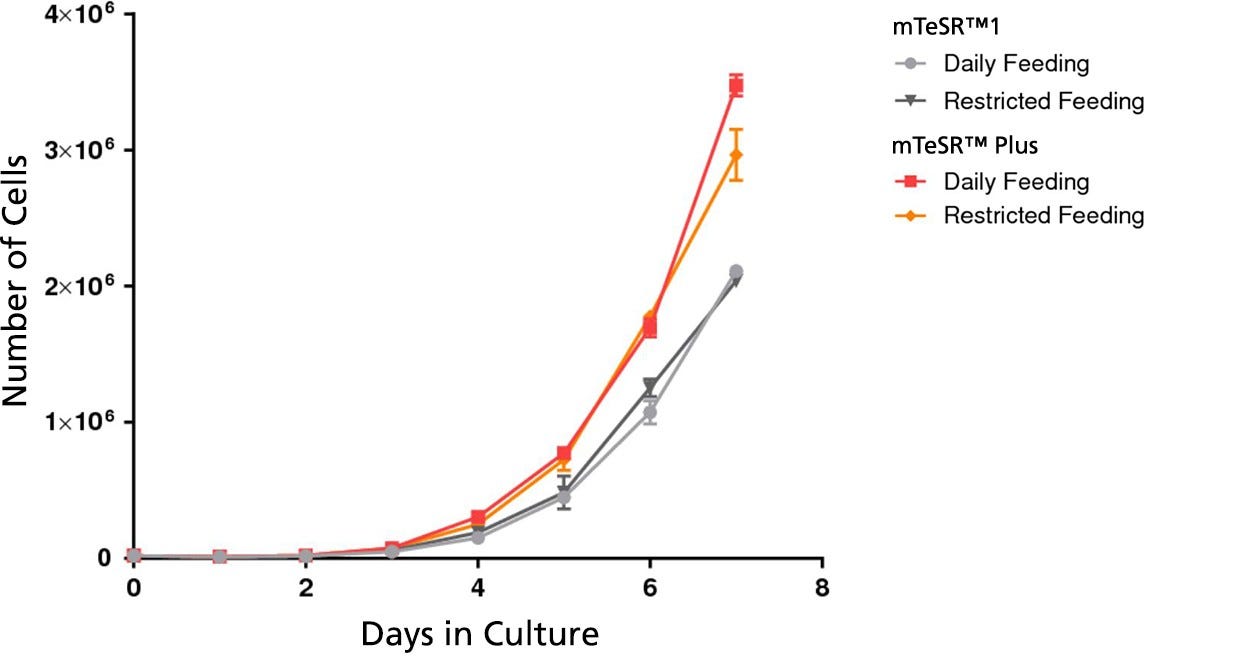
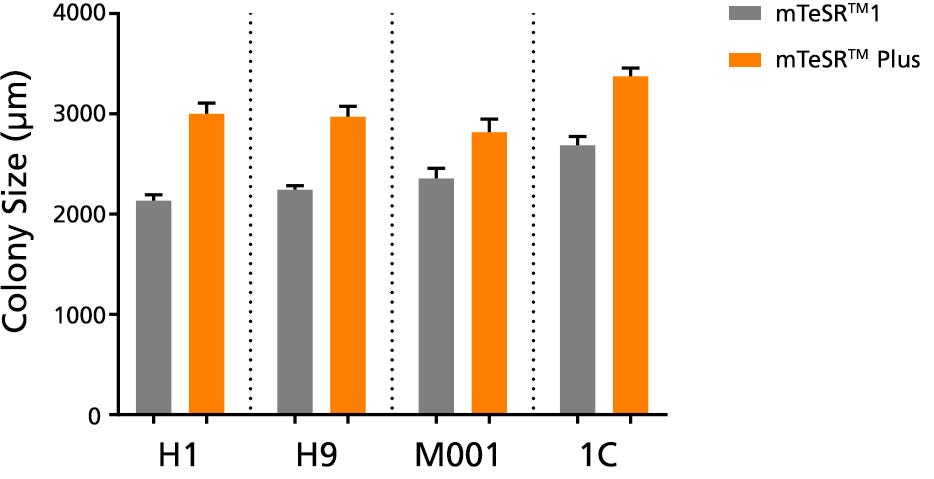
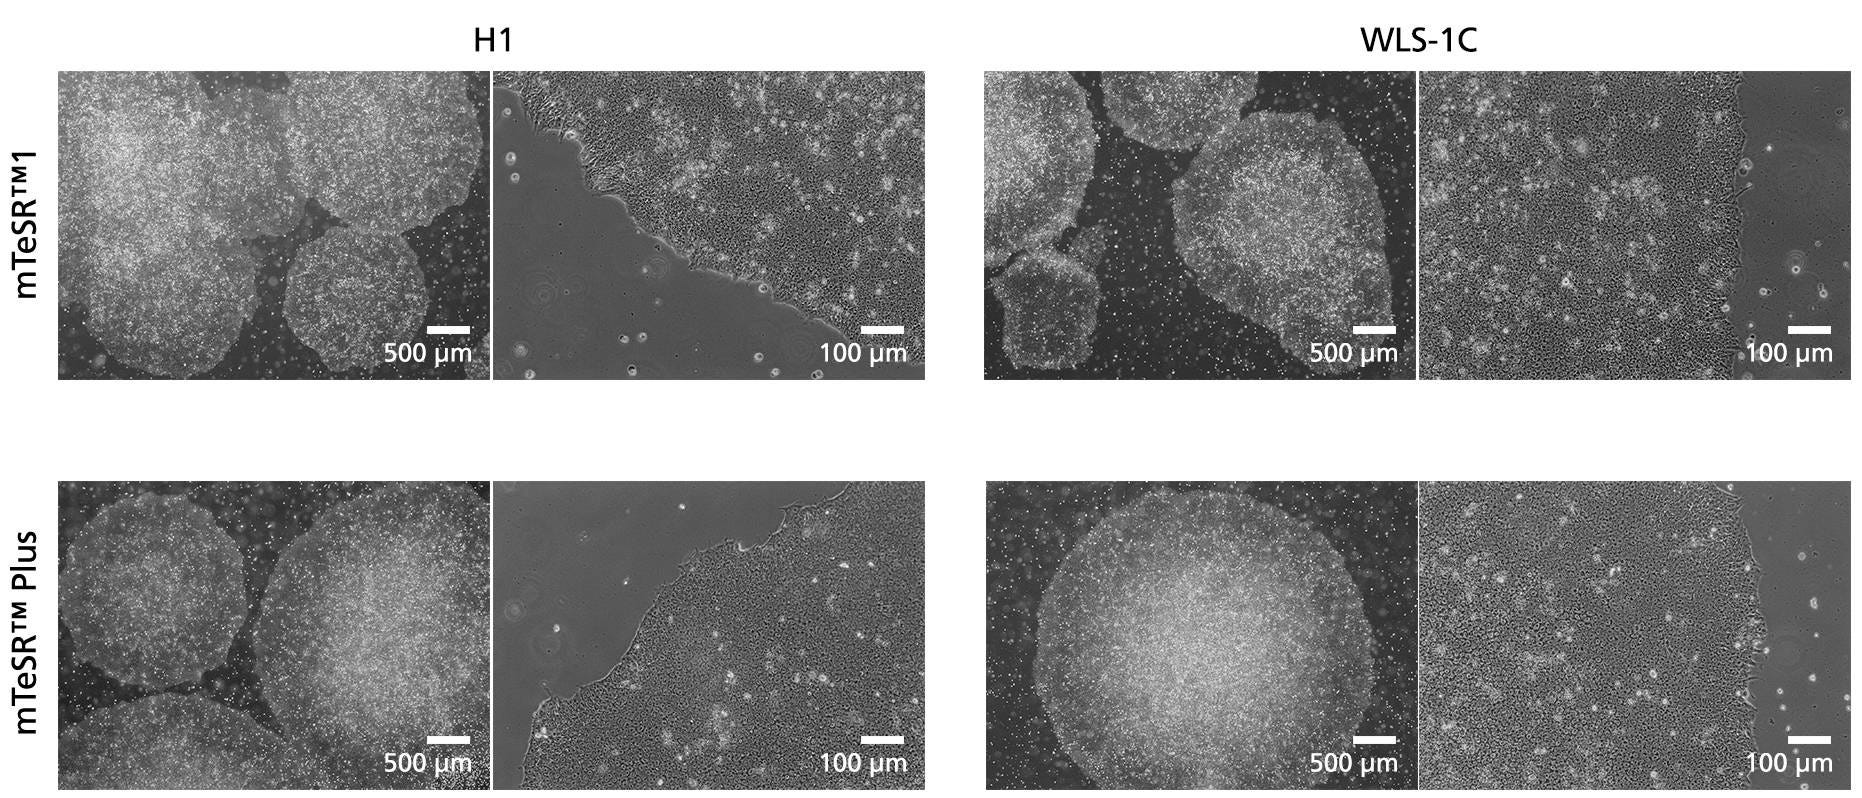
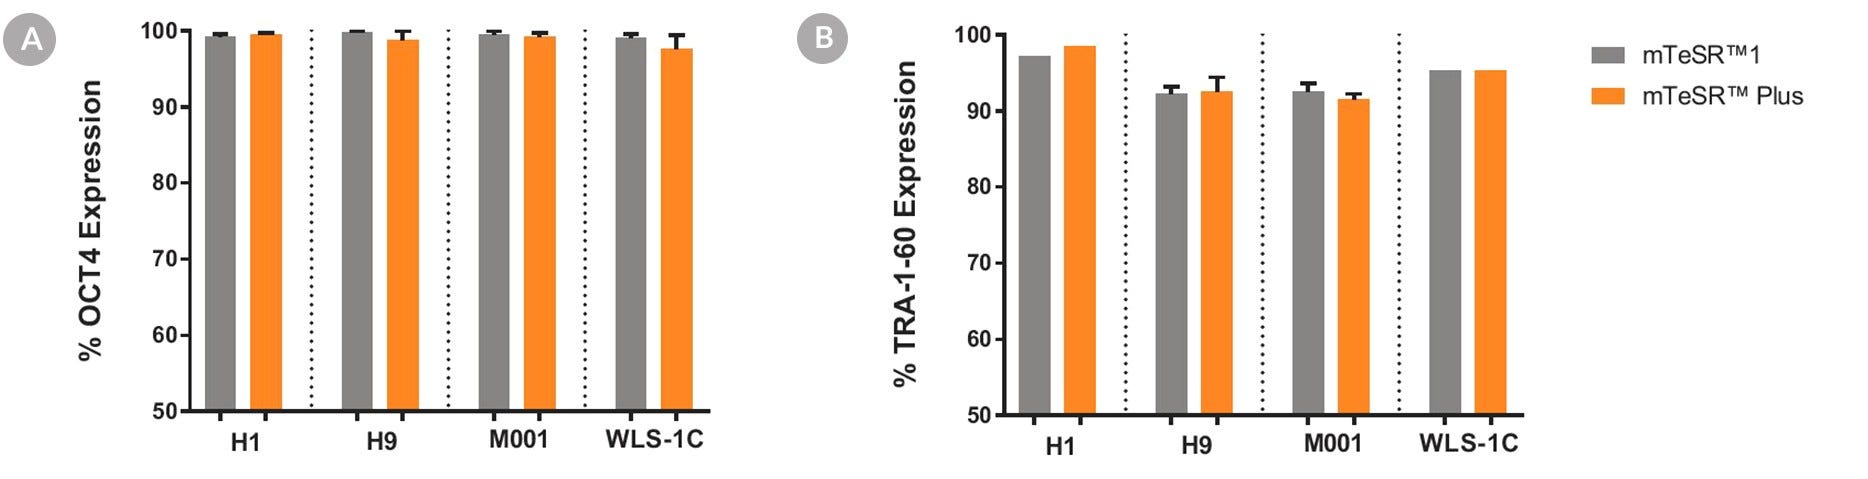
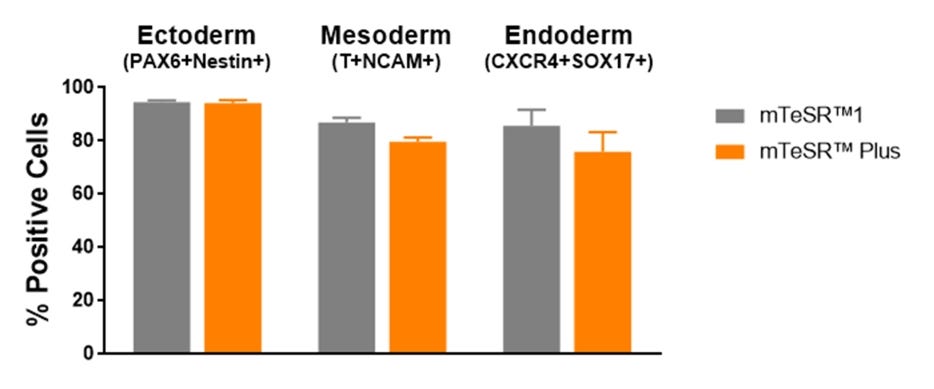
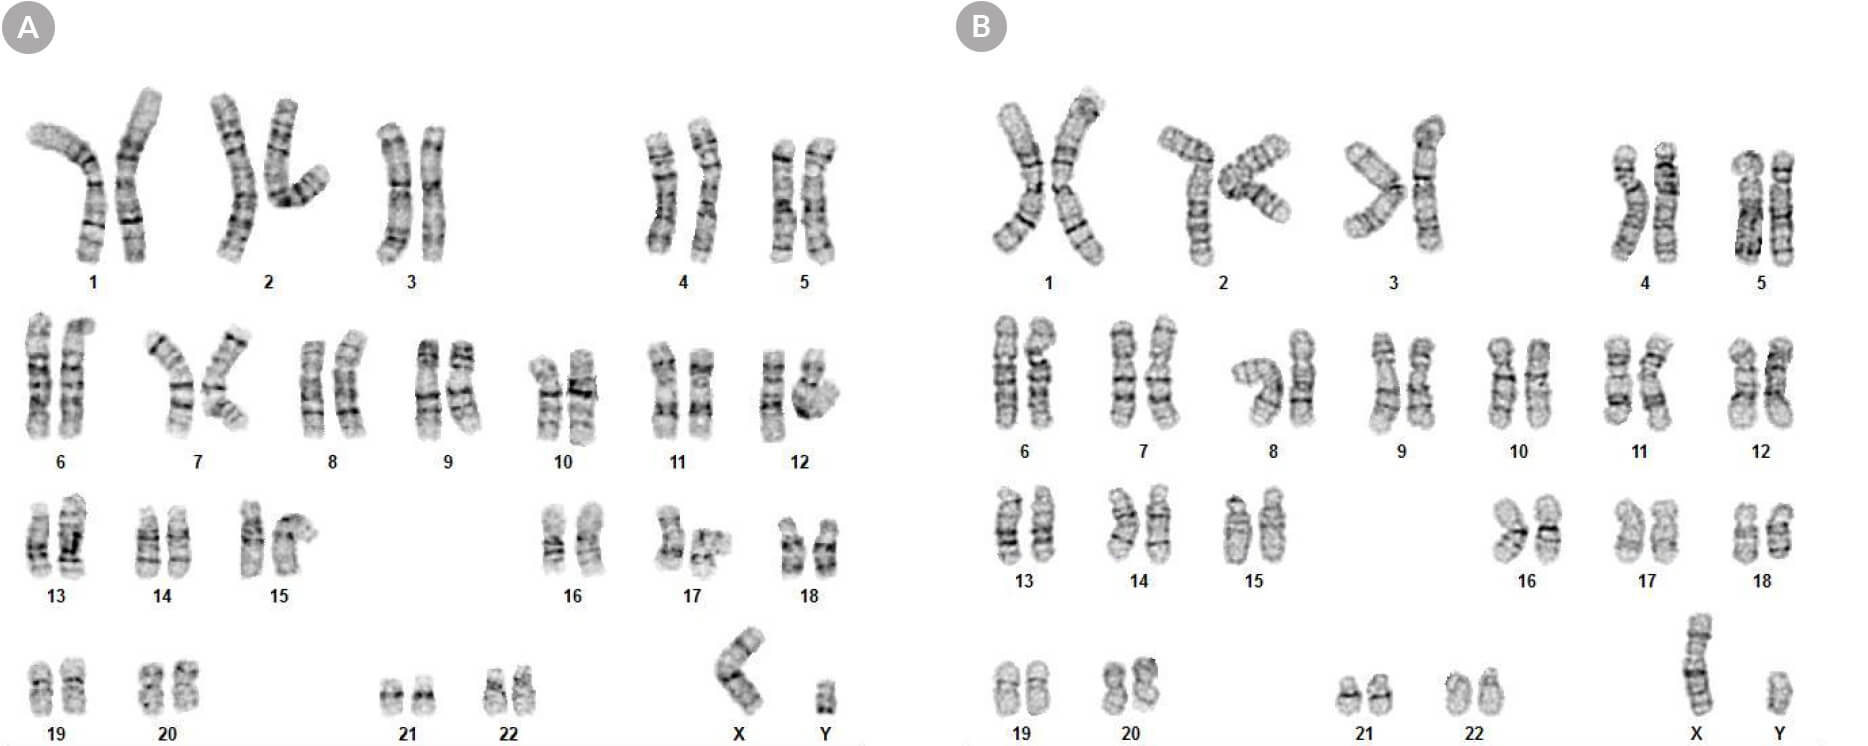
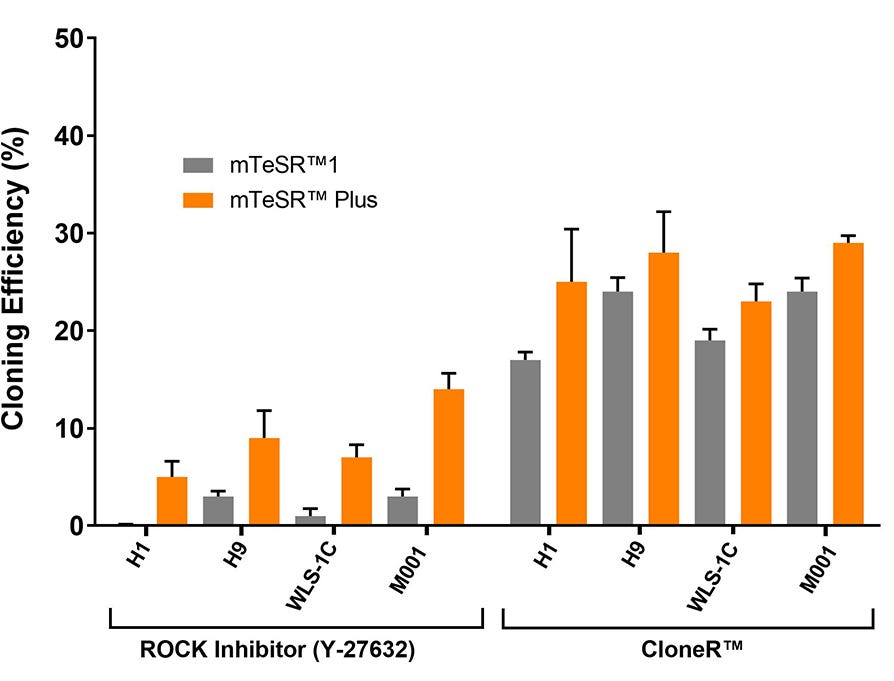
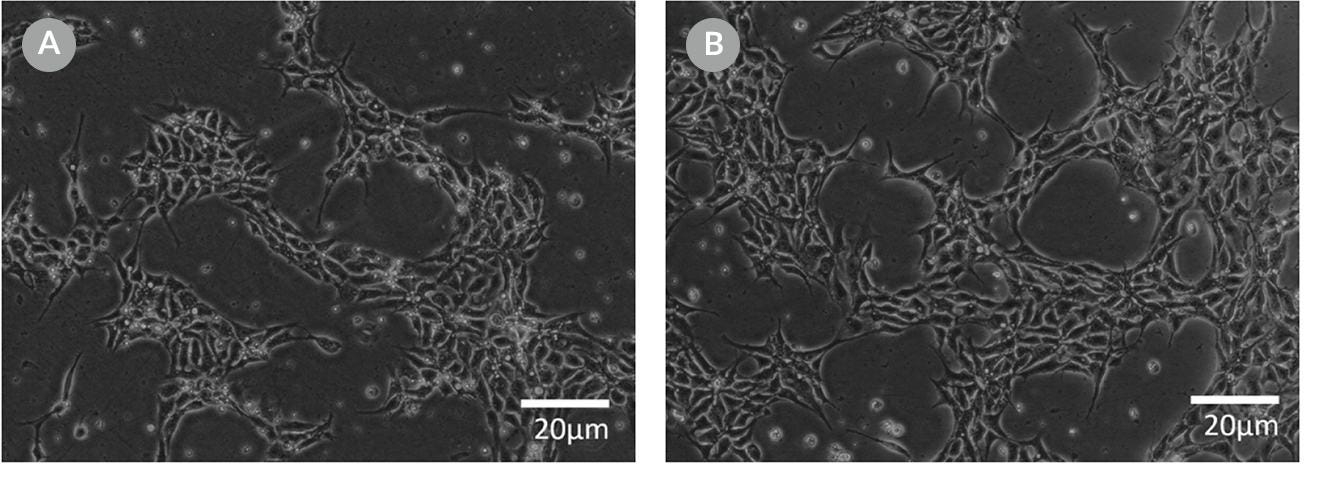
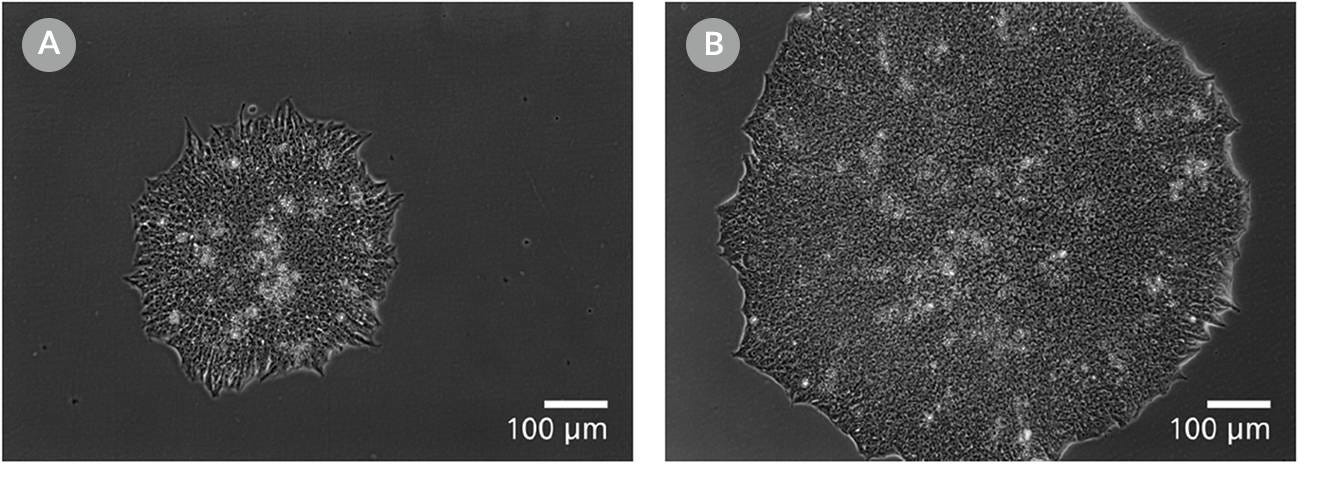
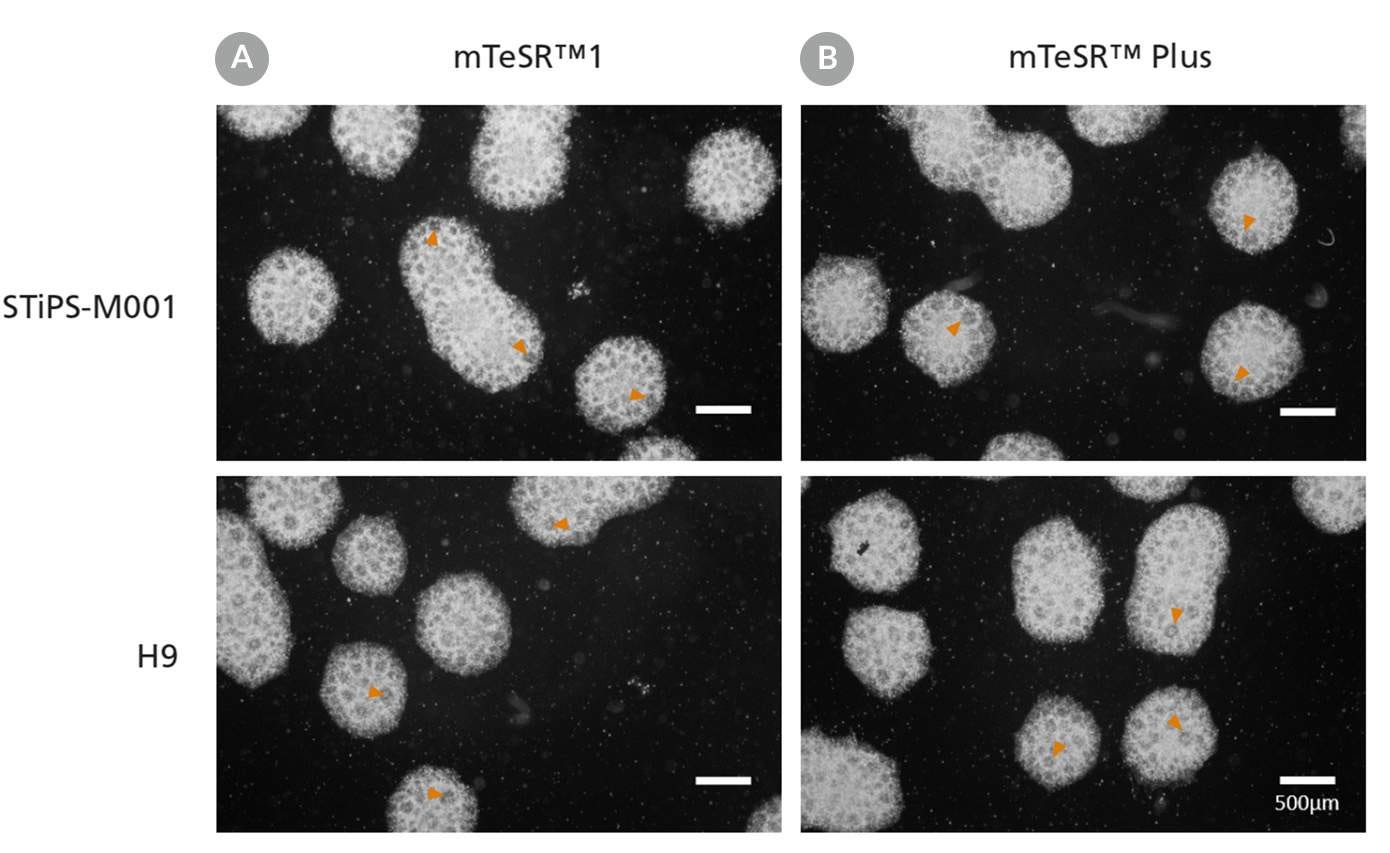
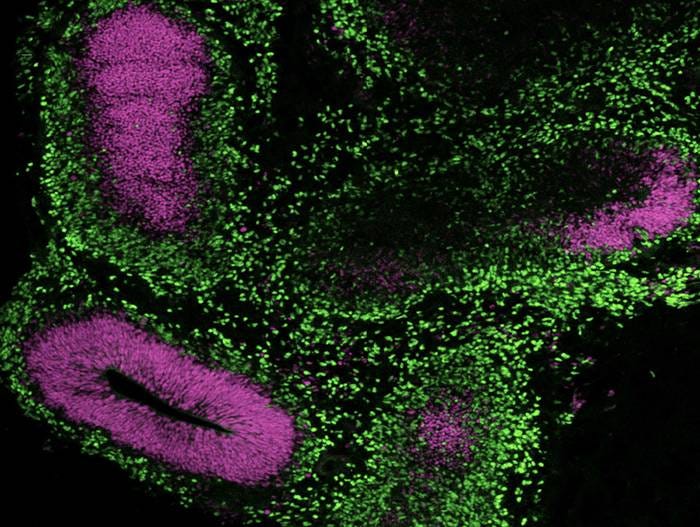
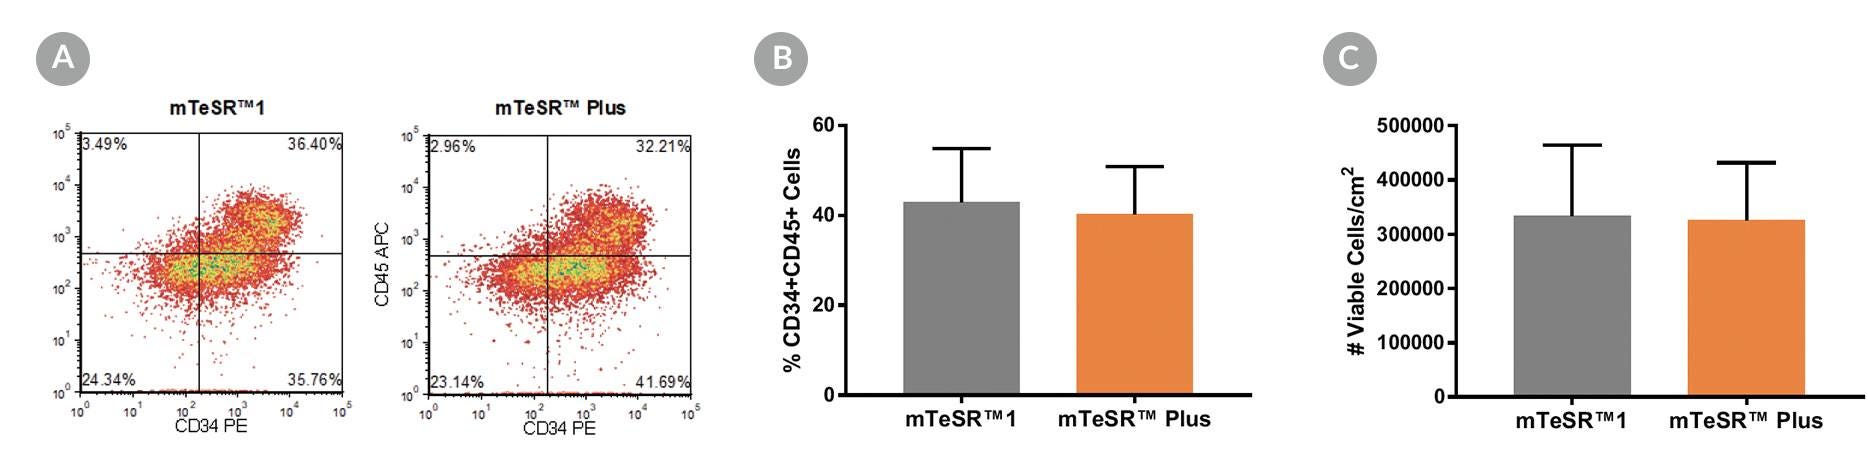
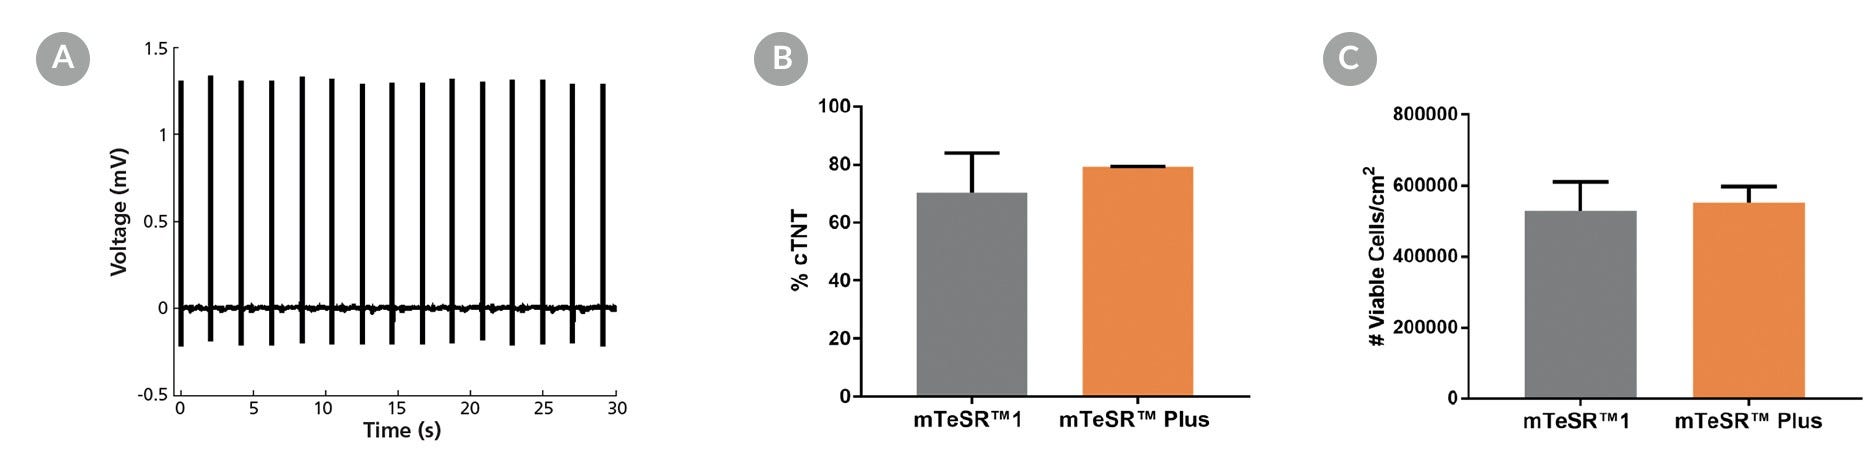
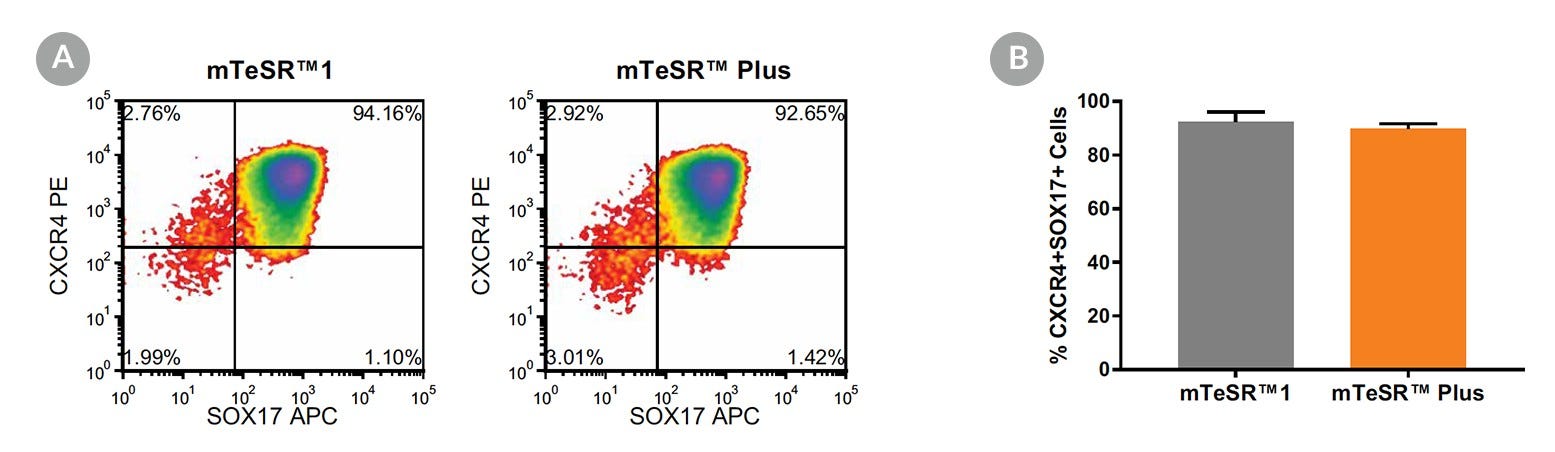
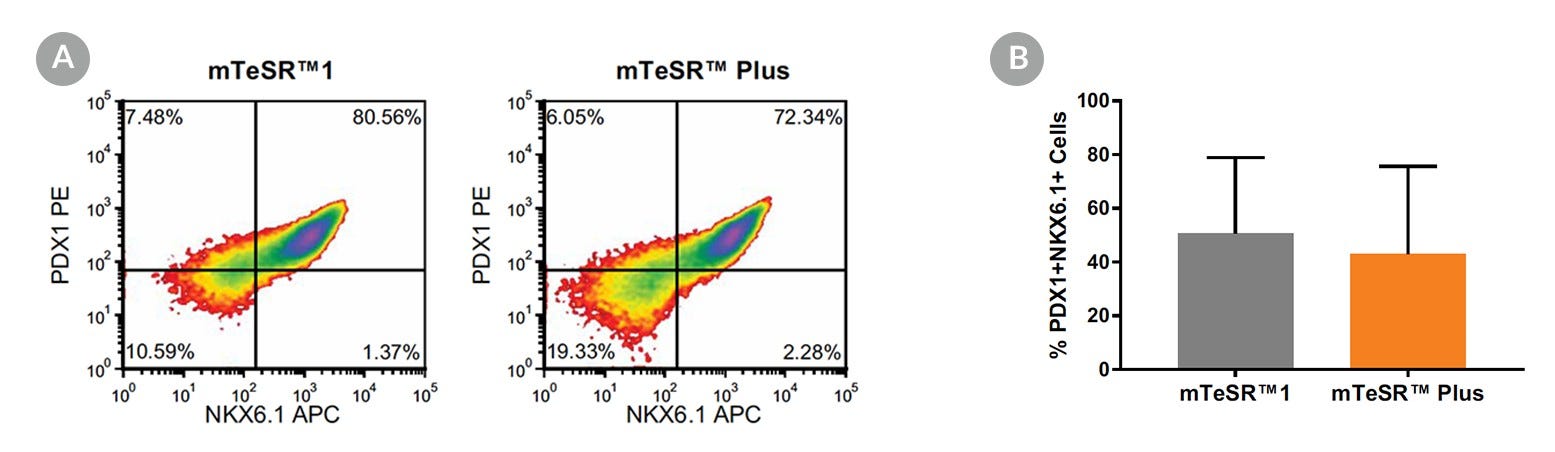
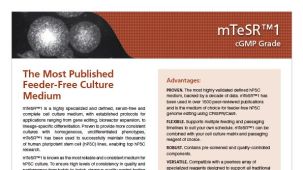
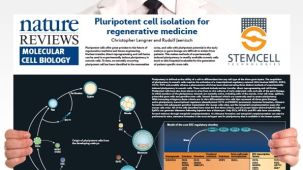
这款稳定的无饲养层维持培养基适用于人多能干细胞 (hPSC),可以在保持细胞质量的同时,让您享受无需周末换液的的灵活日程安排并提升细胞生长特性。mTeSR™ Plus 遵循相关的 cGMP 生产,确保提供最高质量和一致性,适用于基础研究、细胞治疗及新药研究等应用。它基于mTeSR™1(产品号 #85850),这是目前最广泛使用的 hPSC 无饲养层细胞培养基。凭借包括 FGF2 在内的稳定的关键培养基成分和增强的 pH 缓冲功能,您可以使用 mTeSR™ Plus 来维持细胞质量属性,并通过每日或限制性换液来提高细胞扩增速度。每批 mTeSR™ Plus 5X 补充剂均用于配制完整的 mTeSR™ Plus 培养基,然后在使用人多能干细胞 (hPSC) 的培养试验中进行性能测试。
mTeSR™ Plus 与多种培养基质兼容,包括 Corning® Matrigel® hESC 认证基质和Vitronectin XF™(产品号 #07180,由 Nucleus Biologics 开发和生产)。
如需获取更多质量信息,请访问www.stemcell.com/compliance。
如需申请 mTeSR™ Plus 的 FDA 主文件授权书 (LOA),请点击此处。
分类
专用培养基
细胞类型
多能干细胞
种属
人
应用
细胞培养,扩增,培养
品牌
TeSR
研究领域
疾病建模,药物发现和毒理检测,干细胞生物学
制剂类别
无血清
请在《产品说明书》中查找相关支持信息和使用说明,或浏览下方更多实验方案。
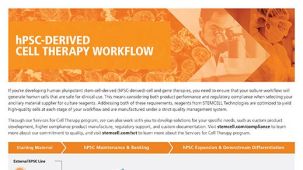
本产品专为以下研究领域设计,适用于工作流程中的高亮阶段。探索这些工作流程,了解更多我们为各研究领域提供的其他配套产品。
| 物种 | 人 |
|---|---|
| 配方 | 无血清 |
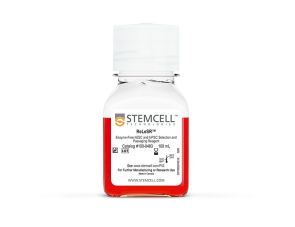
cGMP级、无酶的人多能干细胞选择与传代试剂
<p>用于提高人胚胎干细胞和诱导多能干细胞在单细胞工作流程中存活率的添加物</p>
一次性使用、免维持的人诱导多能干细胞,冷冻
<p>人多能干细胞系,冻存</p>
在线联系


 沪公网安备31010102008431号